
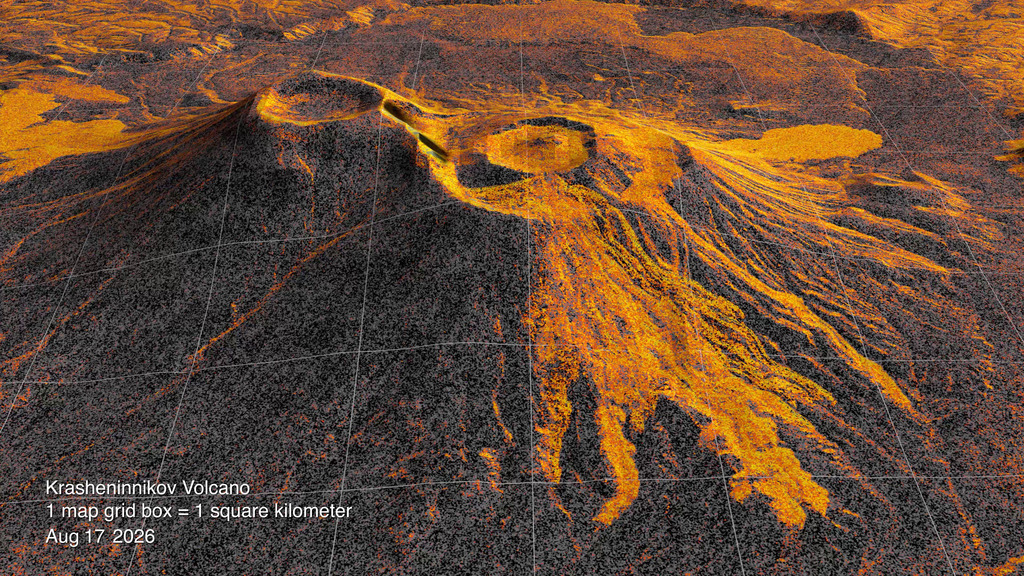
Lava fills a crater, spills beyond its rim and spreads into a widening fan. In a radar animation released September 24, the changing outline of Russia’s Krasheninnikov volcano is assembled from 17 observations by NISAR, the joint U.S.–Indian satellite. The sequence spans December 2025 to August 2026, turning months of growth into a view that can be followed in seconds.[1][2]
The eruption was already under way when that sequence began. The Smithsonian’s Global Volcanism Program dates its onset to August 2, 2025, in Universal Time. Its account describes explosions from the northern cone and a fissure releasing lava on the northwest flank. The volcano consists of overlapping cones within a much larger caldera, so new material enters a landscape shaped by earlier eruptions. A map made once cannot keep up with that changing surface.[3]
Repeated satellite observations offer a way to keep measuring it. They can show where deposits spread and, with a different form of analysis, where the ground moves. Those are valuable clues for scientists trying to understand an active volcano. Turning them into a warning requires another step: working out what caused the change and whether it signals a hazard that is growing, subsiding or simply continuing.[6][13]
Watch NASA’s radar animation, covering December 2025–August 2026 observations.[1][2]
Seeing the surface in reflected waves
The orange in the released visualization does not mean that every bright patch is incandescent rock. Radar supplies its own illumination, sending microwave pulses toward the surface and recording the returning signal. The strength of that return depends on properties such as surface roughness and electrical behavior, as well as the viewing geometry. A rough surface can scatter more energy back toward the antenna; a smooth one can reflect it away.[5]
The instrument gains detail by observing each patch of ground repeatedly as the spacecraft moves. Processing combines those echoes as though they had been collected with a much larger antenna. That is the “synthetic aperture” in synthetic aperture radar. The resulting image contains both the strength of the reflected signal and information about the phase of the returning wave. These are different measurements that can answer different questions about the same landscape.[5]
The distinction becomes clearer beside an ordinary satellite view. On November 14, 2025, Landsat 9 saw a plume drifting northwest from Krasheninnikov and dark lava extending across snowy terrain. That image records the volcano before the first date in the new radar sequence. The plume and snow make the place recognizable, while the later radar series follows changes across many returns. The images describe different dates and should not be treated as simultaneous views.[4]
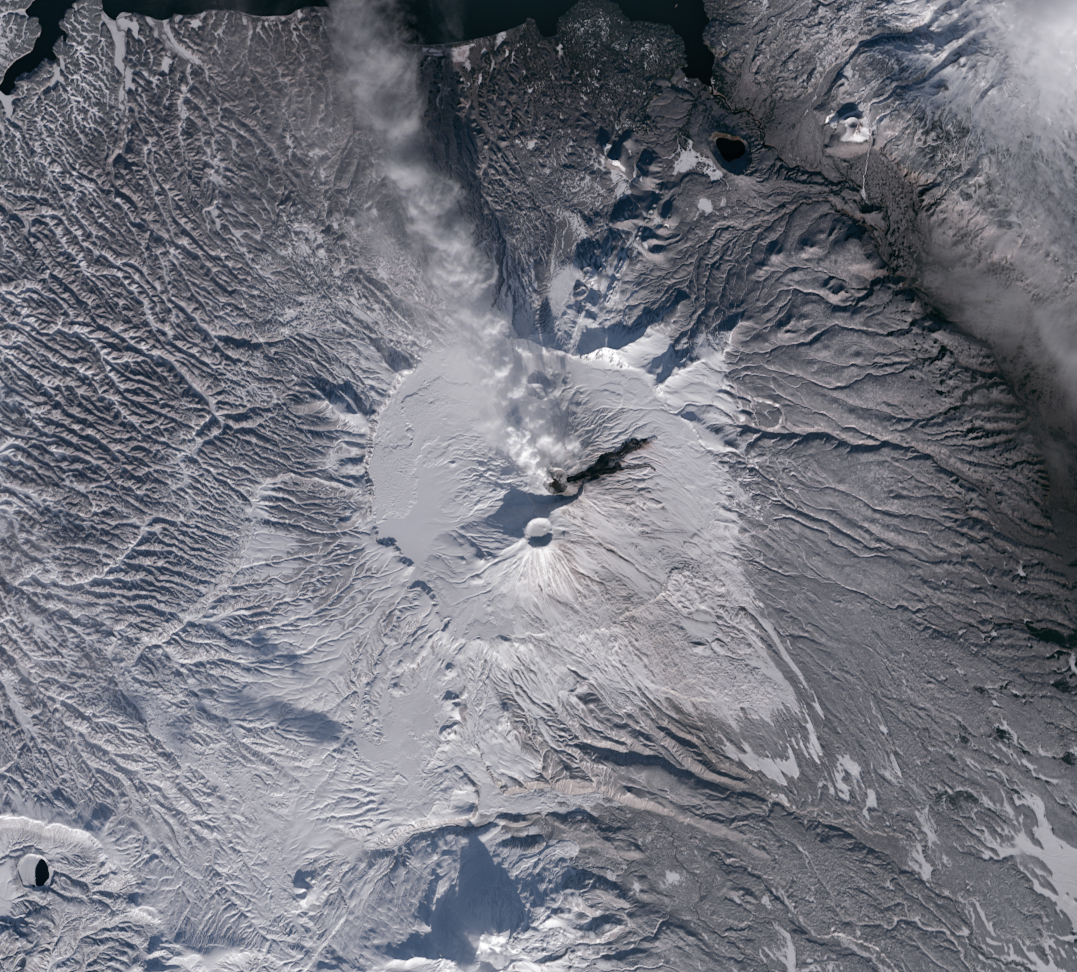
Image details
Original downloaded image; no crop, resizing or generative alteration.
A scientist looking for movement beneath a volcano uses a comparison called an interferogram. It measures changes in the radar path between observations, often displaying them as bands of color. Interpreting those bands requires the observation dates, radar wavelength and direction of measurement. The apparent distance change can contain effects from the atmosphere, orbital uncertainty and terrain as well as actual displacement. Corrections help separate those contributions. A lava-field animation does not, by itself, perform that measurement.[6]
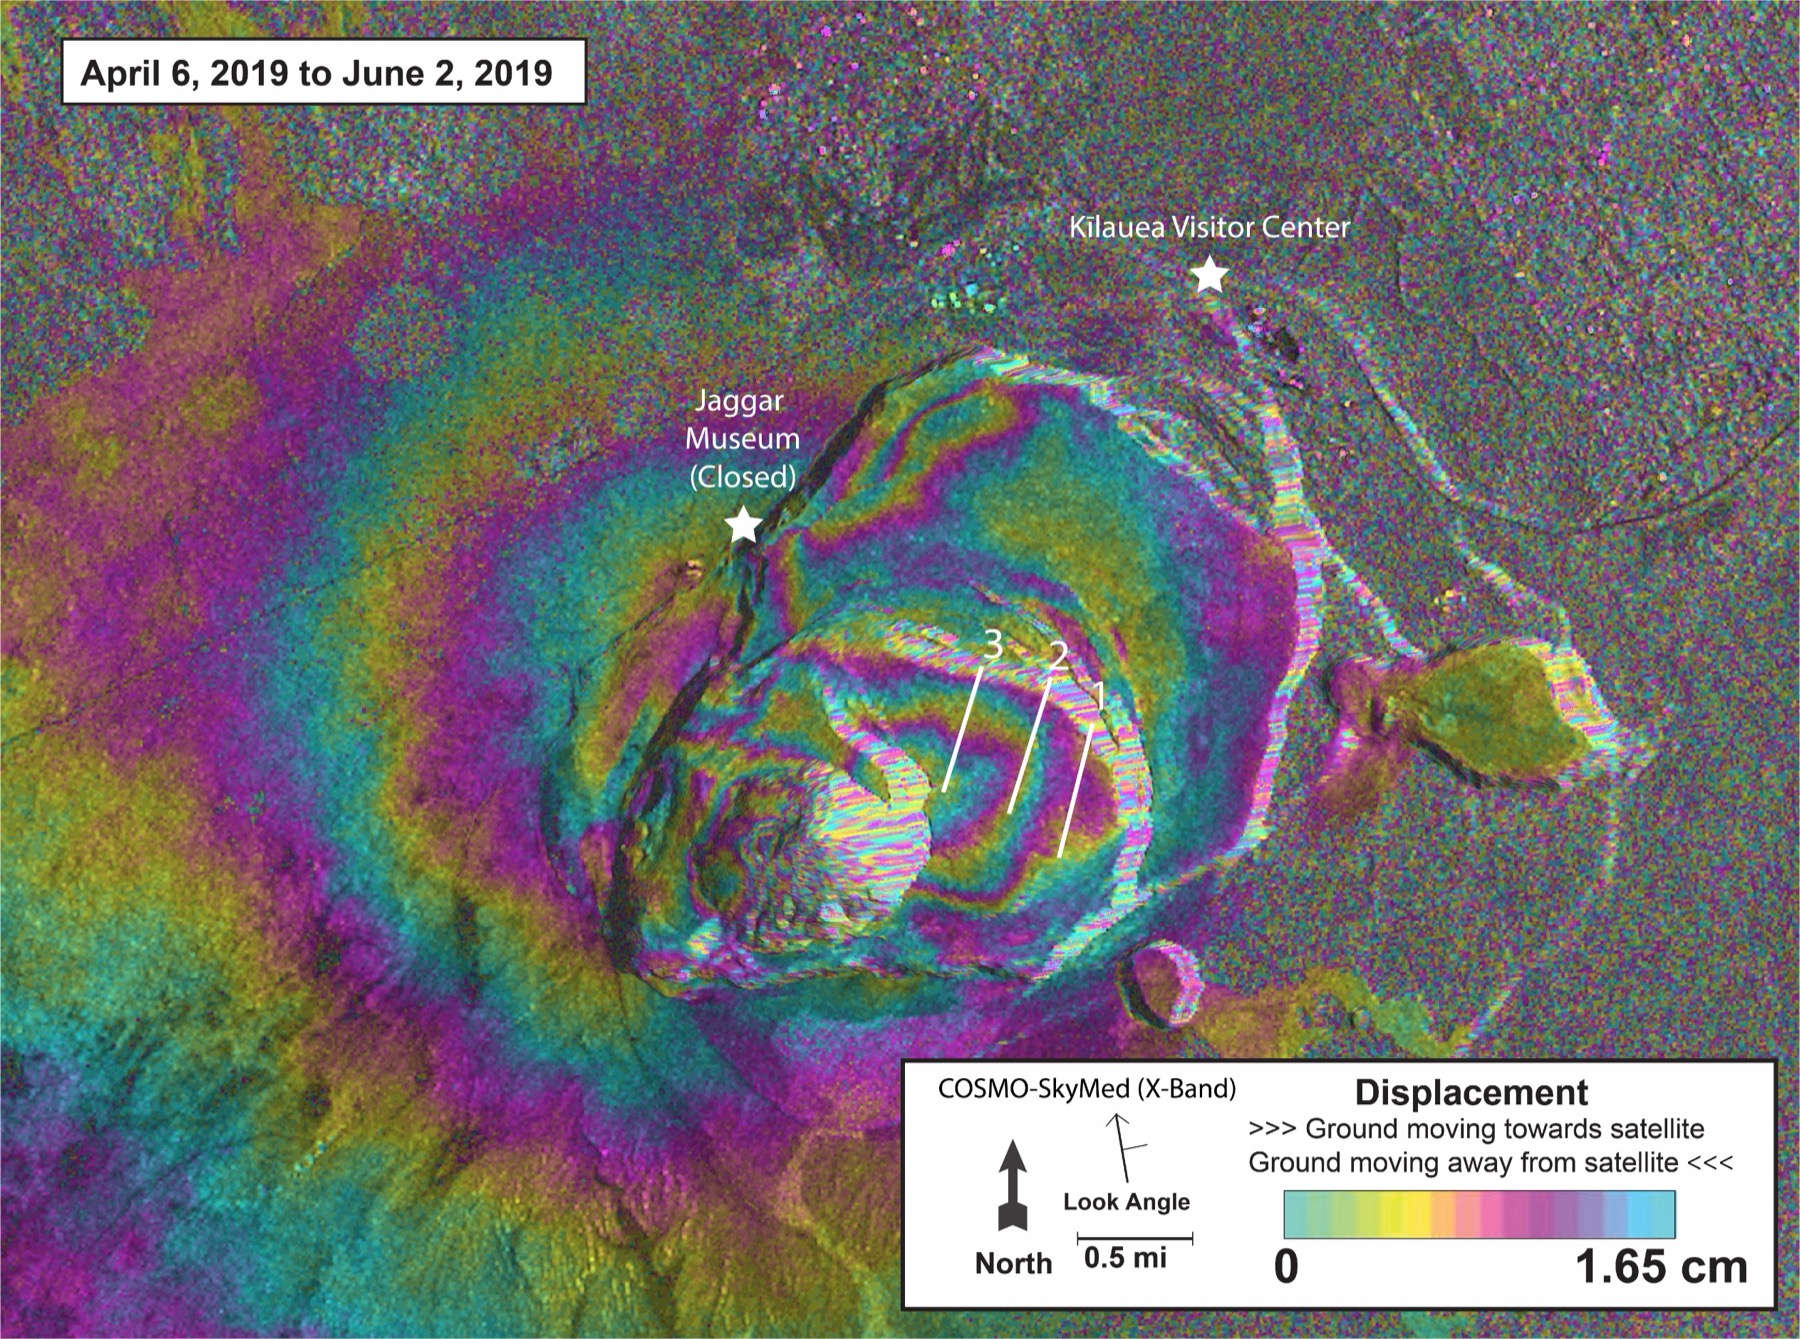
Image details
Proportional resize; JPEG conversion.
NISAR’s archive distinguishes these uses. Some products preserve the radar return in coordinates that can be placed on a map; others combine pairs of observations to estimate displacement. Processing makes the measurements more accessible, but the choice of product still matters. A person tracing the edge of a lava field and a person estimating how much the ground has swollen are asking different questions, even when both start with signals acquired by the same spacecraft.[7]
A longer eruption than the film can show
By September 10–15 this year, lava was still flowing onto the eastern flank of Krasheninnikov’s northern cone, according to the KVERT observations summarized by the Smithsonian. Satellite images showed a persistent thermal anomaly; gas and steam sometimes carried ash. That report extends the observational history beyond the animation’s final August frame. It does not establish conditions today, and the animation is not a current ash advisory.[3]
The start of the eruption also illustrates why different measurements must be brought together. A major earthquake struck off Kamchatka shortly before activity began. Earthquakes can sometimes help trigger an eruption, the U.S. Geological Survey explains, but a volcanic system must already contain eruptible magma and sufficient pressure. A powerful earthquake does not create those conditions from nothing.[16]
In a November 2025 account, JPL geophysicist Paul Lundgren described radar evidence of deformation after the earthquake but before the eruption and interpreted the sequence as earthquake-triggered activity. The newly released lava animation begins months later and cannot independently establish what initiated the eruption.[4]
When swelling does not mean an eruption is imminent
Oregon’s Three Sisters region provides a practical example. In a January 31, 2022, statement, the Cascades Volcano Observatory reported an increase in uplift west of South Sister. Satellite radar indicated as much as 2.2 centimeters of rise between June 2020 and August 2021, and a ground GPS station confirmed continuing deformation. Yet the observatory kept the volcano at normal status and said it saw no sign of an imminent eruption.[12]
The scientists interpreted the behavior as part of a long-running episode, potentially involving small additions of magma several miles underground. They expected a developing eruption to produce stronger combinations of earthquakes, deformation and chemical changes. Those signs were absent at the time. Their January 2022 assessment called for continued monitoring; it is not a statement about Oregon’s current alert status.[12]
The broader research supports that caution. In a 2014 Nature Communications study, Juliet Biggs and colleagues examined 198 volcanoes with an 18-year satellite observation history. Fifty-four had recorded deformation; 25 of those also erupted during the observation window. The association was useful, but the categories included movement before, during and after eruptions. The headline proportion was not the chance that a volcano would erupt soon after a newly detected change.[11]
The researchers also found that observation gaps and the tendency to publish episodes of change made the timing harder to interpret. Deep magma, vegetation, snow and atmospheric effects could complicate detection. The study predates NISAR and does not measure the new satellite’s performance. Its enduring lesson for the current images is specific: the relationship between movement and eruption depends on what was measured, over what interval, and in what kind of volcanic system.[11]
Ground instruments help distinguish those possibilities. Seismometers record rock breaking and signals associated with moving magma or gases. Some signals that appear before eruptions also occur during ordinary background activity. USGS monitoring guidance therefore emphasizes changes in the type, location and intensity of earthquakes, interpreted alongside other observations. A swarm can merit close attention without demonstrating that magma will reach the surface.[13]
Gas and water provide another view into the underground system. As magma rises and pressure falls, dissolved gases can separate and move toward the surface. Heated groundwater carries chemical material upward through fractures. Scientists track those chemical mixtures and emission rates during quiet periods as well as unrest, establishing a baseline against which a new change can be judged.[14]
That baseline helps explain why a long observational record matters even when little seems to be happening. An unusual gas mixture, a shift in earthquake behavior or a patch of rising ground becomes more informative when researchers know what preceded it. Combining those records can test an interpretation that would remain ambiguous in any single instrument. Radar adds wide-area measurements to that work; the other measurements help give its patterns a physical explanation.[14]
The missing observations matter, too
NISAR was planned around repeated measurements across large areas, rather than only taking pictures when an eruption attracts attention. Its observation plan uses different radar modes for different geographic targets and aims for consistent time series. The plan can be reviewed as scientific needs and resources change. That planned repetition makes comparisons possible across seasons and across volcanoes, including places without an extensive ground network.[15]
There is also a practical benefit to observing before an unusual event is recognized. A later measurement can be compared with an earlier view already in the archive. The usefulness of that comparison depends on compatible acquisition conditions: changing how an instrument looks at the surface can alter the signal as well as changing the surface itself. The mission’s geographic observation plan tries to preserve that continuity while serving studies of ice, ecosystems and solid ground.[15]
A scheduled revisit is not a guarantee of an unbroken record. The Alaska Satellite Facility, which distributes NISAR data, documents a permanent instrument data gap from late July 27 to early August 10, 2026. That interval falls within the period illustrated by the new animation. A viewer should therefore read its dates as a sequence of available observations, not continuous surveillance of every stage of the eruption.[8]
The public archive is also still being refined. Products released in July are calibrated but designated provisional because validation has covered a limited set of sites. Earlier beta products used different processing. ASF cautions that combining the two can introduce apparent differences caused by the software rather than the landscape. These qualifications concern the general archive; they do not establish that the released Krasheninnikov visualization is wrong.[8]
Some known problems are especially relevant to measuring small changes. ASF identifies remaining effects from the ionosphere at high latitudes, radio interference, missing downlinked data and processing artifacts. A bright band or a loss of consistency can have an instrumental explanation. Quality information accompanying the products allows analysts to investigate such possibilities instead of treating every visible feature as geology.[9]
How quickly an observation becomes useful
During a crisis, the time between the satellite pass and a usable result matters. ASF lists typical processing delays of 36–72 hours for standard higher-level NISAR products. An urgent-response pathway prioritizes downlink and processing, with estimated delays as short as six hours for mapped products. Faster delivery uses less precise orbit information and omits some atmospheric corrections. Response teams must decide whether that trade-off fits the question they need answered.[10]
Urgent processing usually accelerates an acquisition already in the observation plan; it does not make an orbiting satellite continuously watch one volcano. Nor does a six-hour processing estimate mean a fresh measurement will arrive six hours after any event begins. Acquisition, transmission, processing and interpretation are separate parts of the delay. The system can support a response, but those limits still matter when conditions are changing faster than a satellite can return.[10]
Krasheninnikov’s latest displayed Smithsonian report covers activity beyond the animation’s final frame. Lava continued to emerge, while gas and steam sometimes carried ash. Those separate observations extend the history into September; they leave the next change to be established by the next measurements.[3]
Sources & further reading
Original reporting and research behind this article.
- NISAR observes a growing lava fieldPublished 2026-09-24
- Released radar animation and observation datesPublished 2026-09-24
- Krasheninnikov eruption history and activity reportsLiving record; latest displayed weekly report September 10–16, 2026; checked September 28, 2026
- Landsat view of KrasheninnikovPublished November 20, 2025; image acquired November 14
- How synthetic aperture radar forms an imageTechnical reference updated June 2, 2026; checked September 28, 2026
- Reading an interferogramPublished 2019-06-20
- NISAR data productsUndated reference; checked September 28, 2026
- Data availability, validation and instrument gapUndated reference; checked September 28, 2026
- Known issues in provisional radar productsTechnical reference updated July 30, 2026; checked September 28, 2026
- NISAR urgent-response productsUndated reference; checked September 28, 2026
- Biggs and colleagues: deformation and eruptionPublished 2014-04-03
- Three Sisters uplift information statementStatement dated January 31, 2022; identifier contains January 27
- What volcano earthquakes can revealUndated reference; checked September 28, 2026
- Volcanic gas and water monitoringUndated reference; checked September 28, 2026
- Why NISAR revisits the same placesUndated reference; checked September 28, 2026
- Earthquakes and eruption triggeringUndated reference; checked September 28, 2026
- NASA media-use guidanceRights guidance checked September 28, 2026
- Kīlauea interferogram image and reuse statusImage compares April 6–June 2, 2019; checked September 28, 2026
THE DAYBREAK / THE MORNING LETTER
A little more understanding,
every morning.
The day’s selected stories, the context behind them, and a deeper read. A considered start to your day, delivered to your inbox.
See what’s inside