

A rise in economic output does not necessarily leave more room in a household budget. In August, the US gasoline price index climbed 3.9% from the previous month, helping push the overall consumer price index up 0.4%, both on a seasonally adjusted basis. Energy prices were 16.3% higher than a year earlier. Those increases arrive as expenses to pay, even when factories, technology companies and the wider economy are producing more.[1]
The OECD’s September 23 outlook forecasts global growth of 2.9% this year and 3.0% next year: a small upgrade for 2026 and downgrade for 2027 compared with June. Its data cutoff was September 16.[2]
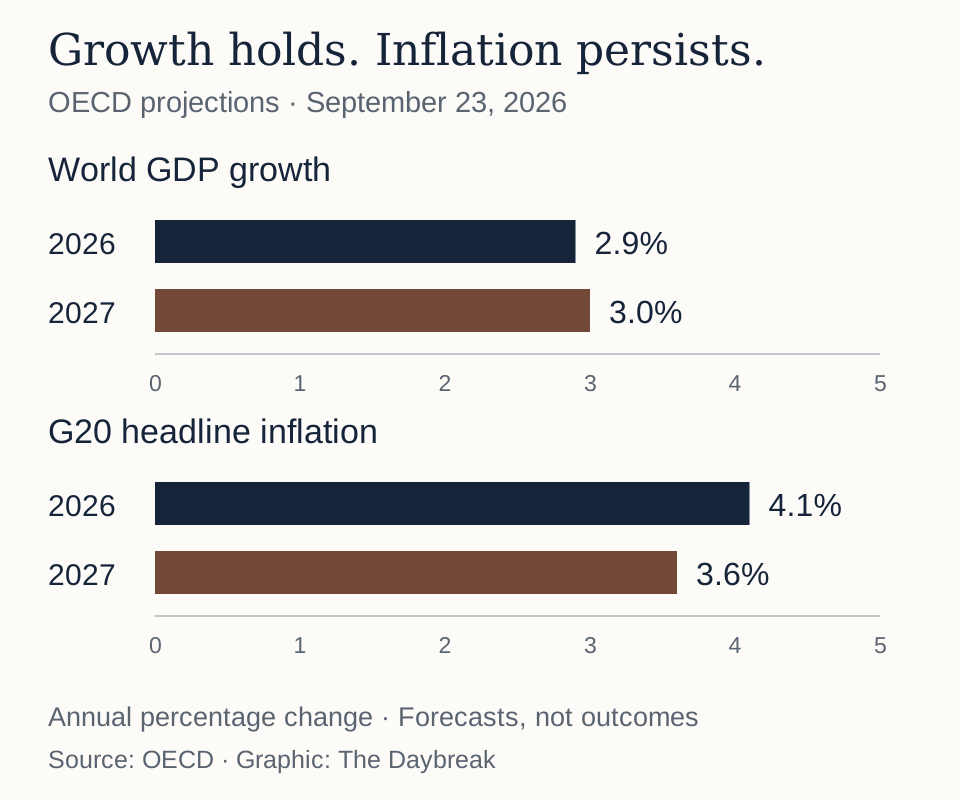
Image details
Original zero-baseline bar chart; no OECD artwork reproduced.
The most revealing question is where that growth is coming from. A dollar spent on computing equipment and a dollar spent on a family outing both create demand, but they reach different businesses and people. A surge in one can support an aggregate measure while another part of the economy barely advances. The recent spending, employment and corporate records show why the distinction matters—and why describing consumers as uniformly collapsing would also go too far.
More income, little additional consumption
The latest available monthly US income report covers July. Inflation-adjusted disposable income rose 0.4%, while real consumer spending increased by less than 0.1%. In current dollars, spending rose 0.2%, with a services increase partly offset by a decline in goods. The household saving rate was 3.0%. These are aggregate estimates; they do not reveal whether a particular renter, homeowner or pensioner gained ground.[3]
The income gain brought little additional consumption. The difference between spending more dollars and buying more goods and services is central to reading an inflationary economy. A larger bill may represent additional purchases, higher prices or both.
The labor market supplies another qualification. Employers added an estimated 162,000 payroll jobs in August, and unemployment remained at 4.1%. Food services and drinking places added 59,000 jobs; local-government education added 42,000, largely offsetting the preceding month's decline. The information industry lost jobs. Neither the national total nor any one industry's result describes every worker's experience.[4]
Continued employment growth helps sustain spending, but it does not make an energy-price increase disappear. The figures describe an economy still generating income and work, with uneven results across activities, rather than a clean division between a booming technology sector and universal distress elsewhere.
September’s final University of Michigan survey offers a more recent view of how consumers feel. Its sentiment index fell to 48.1 from 51.7 in August, while expectations for inflation over the coming year rose to 4.6% from 4.0%. Survey director Joanne Hsu reported weakening views of personal finances and growing concern about high prices. Those responses measure attitudes and expectations; they do not show how much households actually spent during September.[14]
August's price report also resists a single explanation. Prices excluding food and energy increased 0.3% during the month and 2.4% over the year. Gasoline was a large contributor to the monthly headline rise, but shelter also became more expensive. A household's exposure depends on what it buys.[1]
Europe faces a similar tension with different numbers. Eurostat's final August release put euro-area annual inflation at 3.2%, up from 2.9% in July. Services contributed 1.43 percentage points and energy 1.29 points. Energy mattered greatly, but services still made the largest contribution. That composition complicates the hope that cheaper crude alone will quickly bring every price measure back to target.[5]
The expensive journey from crude oil to usable fuel
The International Energy Agency's September oil report describes a problem extending beyond the price of crude. Its August estimates put refinery processing 4.2 million barrels a day below the year-earlier level. Net exports of diesel and gasoil from Gulf countries in August were only a little over a quarter of their prewar level. Disruptions to Russian refining compounded the shortage. The IEA also estimated a further 95 million-barrel decline in observed global inventories during August.[6]
The distinction between crude and refined products is practical. Crude must be processed into the particular fuels that trucks, machinery and heating systems use. More crude in one location cannot immediately replace missing refinery output somewhere else. Transport capacity, processing equipment and the mix of products a refinery can make all stand between a barrel of oil and the customer who needs fuel.
Inventories allow consumption to continue when current supply falls short. They also make the disruption less visible for a time: a customer can still obtain fuel even as the stock available for future deliveries shrinks. A drawdown therefore says something different from an immediate shortage at every pump. Its significance lies partly in how much room remains to absorb the next interruption.
The US Energy Information Administration's September outlook expected distillate inventories to fall below 100 million barrels in September and remain below the previous five-year range through much of 2027. It raised its forecast of the average US retail diesel price to $5.07 a gallon for 2026 and $4.40 for 2027. Those are annual forecasts, not today's pump prices. Its inputs were finalized September 3.[7]
EIA projected a 2027 Brent average of $74 a barrel; the OECD used $85 based on September 14 market assumptions. Different methods and dates prevent treating that gap as an observed price change.[7][2]
For businesses, fuel expenses sit alongside wages, financing costs and materials. Whether a company passes an increase to customers depends on competition, contracts and demand. A rise in diesel does not translate mechanically into the same percentage increase in food or manufactured goods. It does add another cost that someone must absorb, reduce or recover.
The investment is visible; its eventual return is harder to measure
Technology companies' financial statements show the scale of the other force supporting activity. Microsoft's cash-flow statement recorded $35.802 billion of additions to property and equipment in the quarter ended June 30, compared with $17.079 billion a year earlier. For the full fiscal year, the figure was $115.948 billion. Its quarterly operating cash flow was $55.441 billion. These are company-wide accounts, not a separate audited measure of spending solely on AI.[8]
In its July 29 results, Meta reported $31.08 billion of second-quarter capital expenditures, including principal payments on finance leases, and projected $130 billion to $145 billion for the full calendar year. It reported $31.86 billion of operating cash flow and $784 million of free cash flow for the quarter. Meta's measure includes a lease component, so placing it directly beside Microsoft's cash additions without an explanation would obscure a meaningful accounting difference.[9]
These expenditures create orders before the final return on the equipment is known. Building and fitting out computing capacity pays suppliers today. The investment's longer-term success depends on what that capacity earns or allows its customers to do. A company can spend heavily, report growing revenue and still face questions about the future return on its newest assets. The expenditure itself cannot answer all three questions.
There is evidence of strong activity among suppliers. Taiwan Semiconductor Manufacturing Co. reported August revenue of NT$514.81 billion, 53.3% above the year-earlier month. Revenue for January through August was up 39.3%. The monthly release covers the company as a whole; it does not isolate the portion generated by AI, or distinguish the effects of prices and product mix from the number of chips shipped.[10]
The factory report released September 25 shows similar differences beneath a national total. Census estimated August orders for durable manufactured goods at $338.6 billion, virtually unchanged from July. Yet orders for nondefense capital goods excluding aircraft rose 1.6%, and shipments of that category increased 0.6%. These preliminary figures are adjusted for seasonality but not inflation. They also distinguish commitments from deliveries: manufacturers can receive an order now and ship the equipment later. The report supplies broader evidence of business-equipment demand without isolating AI purchases or replacing the household-spending figures.[15]
The wider building economy provides a useful counterpoint. Census estimated that total US construction spending in July was 3.8% below a year earlier. Private nonresidential spending rose 0.4% from June, while residential spending weakened. The reported monthly change in total construction was within the survey's uncertainty range. These are current-dollar construction estimates, with a different scope from technology companies' global equipment purchases.[11]
The records can therefore coexist without contradiction. A small number of very large buyers can expand their facilities and equipment rapidly while a broader measure of building activity falls.
Central banks are responding to the prices already arriving
On September 16, the Federal Reserve raised its policy-rate range by a quarter-point to 3.75%–4%. The committee described solid economic activity, resilient domestic spending and elevated inflation. Its decision is evidence that policymakers did not view a still-growing economy as a reason to tolerate continuing price pressure.[12]
The European Central Bank had announced an increase in its three policy rates on September 10. Its deposit rate became 2.50% on September 16. Alongside that decision, the ECB projected 2027 euro-area growth of 1.4% and inflation of 2.5%, while emphasizing uncertainty and declining to commit to a future rate path. These projections differ from the OECD's later outlook, another reminder that forecasts are conditional judgments rather than an agreed schedule of events.[13]
Higher borrowing costs affect different people at different times. An existing fixed-rate borrower and a business arranging new financing do not face the same immediate change. The policy challenge is that restraining demand can help limit inflation while also making investment and discretionary spending harder to finance. Fuel supply cannot be restored simply by changing an interest rate.
The evidence so far leaves room for continued growth and continued pressure on households. There is real spending on new productive capacity, employment is still increasing, and the latest US monthly income figure improved. There are also higher fuel bills and very little additional real consumption in the latest spending release. The next US income and spending report arrives September 30, alongside revisions to earlier estimates. Until then, the July figures remain the latest monthly observation—not a description of what consumers have already done in September.[3]
Sources & further reading
Original reporting and research behind this article.
- BLS consumer pricesAccessed September 26, 2026
- OECD interim outlookAccessed September 26, 2026
- BEA income and outlaysAccessed September 26, 2026
- BLS employment reportAccessed September 26, 2026
- Eurostat August inflationAccessed September 26, 2026
- IEA September oil reportAccessed September 26, 2026
- EIA September outlookAccessed September 26, 2026
- Microsoft fiscal fourth-quarter resultsAccessed September 26, 2026
- Meta second-quarter resultsAccessed September 26, 2026
- TSMC August revenueAccessed September 26, 2026
- Census construction spendingAccessed September 26, 2026
- Federal Reserve statementAccessed September 26, 2026
- ECB September decisionAccessed September 26, 2026
- University of Michigan final September consumer surveyAccessed September 26, 2026
- Census August advance durable-goods reportAccessed September 26, 2026
THE DAYBREAK / THE MORNING LETTER
A little more understanding,
every morning.
The day’s selected stories, the context behind them, and a deeper read. A considered start to your day, delivered to your inbox.
See what’s inside